Using Reduced Graphs to Visualise Lead Optimisation SeriesJess Stacey1, Val Gillet1, Stephen Pickett2 |
|
| 1Information School, University of Sheffield 2Molecular Design, Computational Sciences, GlaxoSmithKline |
|
| A common approach to lead optimisation is to explore the chemical space around a known active compound by varying its substituents in order to build a structure activity relationship. The resulting chemical series is typically represented as SAR tables, Markush structures that show the core scaffold and the substituents as R groups. (Agrafiotis, Shemanarev, Connolly, Farnum, & Lobanov, 2007; Hu, Stumpfe, & Bajorath, 2016) While medicinal chemists are familiar with SAR tables, the standard approach is based on specific substructural fragments which gives a limited view of the chemical space that has been explored. For example, a slight change in the central scaffold would lead to a new chemical series; and these variations may not correspond to variations in the potential interaction patterns that could be formed with a receptor. With the increasing interest in active learning and other data-driven approaches to lead optimisation there is a need to be able to describe the emerging SAR and provide a rationale for the design decisions in the context of this SAR. This is the motivation for the current project.
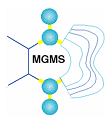
We describe the development of a new flexible tool to help chemists visualise the chemical space explored within a lead optimisation project. The visualisation tool is based on the SAR table, which chemists are already familiar with, however, it is automatically generated from the data and allows the components of the compounds within a lead optimisation series to be displayed at different levels of detail. The molecules within a project are clustered; each cluster is then represented by one or more core reduced graphs found using a maximum common subgraph approach; the reduced graph core forms the basis of the visualisation. (Gardiner, Gillet, Willett, & Cosgrove, 2007; Gillet et al., 1987) The visualisation tool is interactive enabling the user to move between node descriptions and the underlying functional groups. Furthermore, a variety of graphical techniques are available to indicate the extent to which the chemical space represented by the core has been explored. For example, where there have been several different variations of a substituent but each instance represents the same pharmacophoric features these are represented as a single reduced graph node. Agrafiotis, D. K., Shemanarev, M., Connolly, P. J., Farnum, M., & Lobanov, V. S. (2007). SAR Maps: A New SAR Visualization Technique for Medicinal Chemists. J. Med. Chem., 50(24), 5926–5937. https://doi.org/10.1021/jm070845m |


